
Digital transformation solution for monitoring reciprocating compressors
Digital transformation is changing the way industry is doing business, and this includes machine condition monitoring of production assets. Hydrocarbon Processing (HP) had the opportunity to talk with two specialists in this field:
- Mike Hastings (MH), Senior Application Engineer, Brüel & Kjær Vibro
- Jon Fox (JF), Product Manager, Brüel & Kjær Vibro.
Jon and Mike explain how a special monitoring solution was implemented on a couple of reciprocating compressors at an industrial plant and integrated to their enterprise-wide data management system to reduce machine downtime and maintenance costs.
HP: The topic we are going to talk about is an enterprise-wide data management solution for monitoring reciprocating compressors. First, your project was focused on reciprocating compressors. Is there something special about this machine compared to other types of compressors?
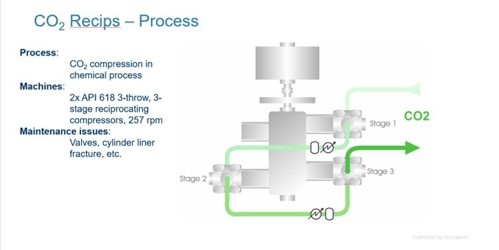
MH: The reciprocating compressor (recips) is a unique type of machine designed for special applications. Its positive displacement principle enables it to efficiently compress low to moderate volumes of gas to a high pressure, compared to a centrifugal compressor. This is especially true for low molecular weight gases such as hydrogen, where recips are used almost exclusively in oil refineries for hydrotreating and hydrocracking services. In this particular case study, the recips are compressing CO2 (carbon dioxide) in a chemical process, and I should mention that CO2 is not a light gas like hydrogen. The justification for selecting recips to handle CO2 instead of centrifugal compressors depends very much on process gas pressure, flow and temperature. Moreover, there are also other considerations that are unique to the recip that must be considered, such as a greater need for effective pulsation damping for CO2 applications compared to other gases. There are also more stringent requirements for leak detection and control of CO2. Nevertheless, recips are used for several high-pressure moderate flow applications such as CO2 injection into oil and gas production sites for enhanced recovery. They are also used in CO2 capture, transport and sequestration for underground storage, for example, in depleted oil and gas fields. In our project, the two 3-throw, 3-stage machines compress CO2 in a chemical process. FIG. 1 shows one of the recips monitored at the chemical plant.
Recips have their special process niche compared to centrifugal compressors, but because of the way they are designed and operate, they require more maintenance and a much more complicated monitoring strategy to keep them running, compared to centrifugal compressors.
HP: What are the maintenance issues with this type of machine, and why would it be complicated to monitor them?
MH: More maintenance is required because the reciprocating motion of the running gear creates impacts that stresses components such as the piston, piston rod, crosshead and connecting rod. This results in a wide range of potential failure modes not seen in other machines. In addition to the running gear, there are also other components that could wear out or break under stress during the lifetime of the machine, such as the compressor valves, rider bands and piston rings, in addition to the crank gear components.
From a monitoring point of view, the reciprocating motion of components requires an entirely different monitoring strategy compared to a centrifugal compressor. This includes specialized sensors and monitoring techniques that are not used with other machines.
Despite this, believe it or not, recips are monitored less than the centrifugal compressors even though there are more potential failure modes to watch over. There are several reasons for this, but it is mostly because of a lack of understanding of the monitoring techniques and diagnostics needed for these machines. There are unique challenges for monitoring this machine, not only because of a lack of understanding of monitoring techniques, but also because of the challenges in managing the monitoring data, which is more complicated than what is used for centrifugal compressors.
HP: So, the recip has unique potential failures that are different from other machines. What kind of monitoring strategy is needed for that?
MH: The monitoring techniques are unique in the sense that they are not just for detecting mechanical faults of components, but also for detecting gas leaks. Most of the time, gas leaks are contained and not released into the atmosphere, but this will still impact the efficiency of the machine, as well as meeting capacity requirements of the processes it feeds.
In any case, the criticality and occurrence of the typical potential failure modes and their operation and maintenance consequences is different for different applications, so the monitoring strategy will also be different.
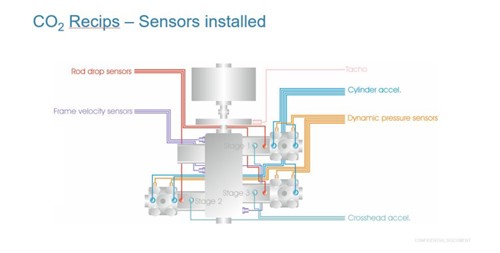
Here (FIG. 2), you can see the numbers of sensors installed on each recip at the chemical plant, which includes displacement sensors, accelerometers, velocity sensors, dynamic pressure sensors and a phase reference sensor.
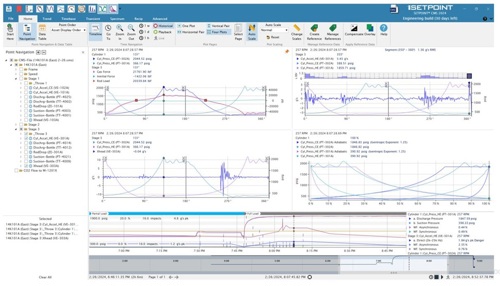
In FIG. 3, you can see several specialized plots used for diagnosing recip component faults and leaks, such as rod load, pressure vs. crank angle, vibration vs. crank angle and pressure-volume plots. Some of these plots overlay each other to improve diagnostic reliability.
There are also certain calculated performance measurements that are initially taken in and processed in the monitoring system itself but are then further calculated in the analytics portion of the enterprise data system and stored there and monitored to alarm limits. This includes the actual swept volume and integrated pressure-volume work, which is used in a lot of other calculated values such as indicated power, actual volumetric efficiency and valve power losses.
Jon can talk more about how the data is managed, which not only includes data storage, but also where the measurement techniques are monitored and how the data is shared with all the inter-connected systems for visualization, alarming, notification and further analytics.
HP: Jon, can you explain how the raw measurement data and analytics are managed?
JF: Traditionally, the monitored data was all taken care of by proprietary, stand-alone monitoring systems, but this legacy is changing now.
The AVEVA PI system, a data historian, stores data from several monitoring systems, including process data, in a central location. This significantly reduces IT infrastructure and complexity since there is no need for individual data file servers for each monitoring system. The dashboard also streamlines data visualization for numerous systems. Finally, analytics, event detection and notification can also be done in the PI system, thus nearly rendering all monitoring systems as simple data pumps.
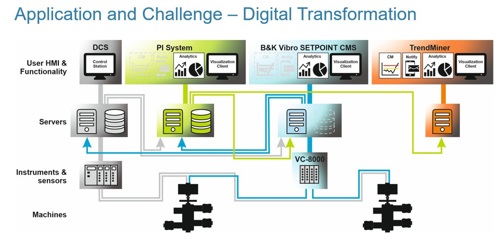
FIG. 4 shows all the interconnected systems. In practical terms, however, not everything can be done in the data historian. There are certain calculated measurements that are done in the proprietary systems that could not be practically done in the PI system. Also, there are certain performance plots that can only be viewed in the monitoring system itself. Fortunately, for monitoring systems with native connections to the PI system, these calculated measurements and plots can be easily accessed in the proprietary monitoring system by clicking on an icon in the PI Vision dashboard.
As the PI system data is open to external systems, as well, even visualization, event detection, notification and analytics can be done by service providers.
This is actually the case in this case study.
HP: So, you are saying a service provider is used for visualization, event detection and notification instead of the PI system. Can you tell us more about this?
JF: It is not uncommon for people with different roles, such as managers, maintenance, supply chain, etc., to require information from a different perspective. This was the case in our case study, where TrendMiner was used for not only as a dashboard with alarming and notification capability, but also for doing additional analytics.
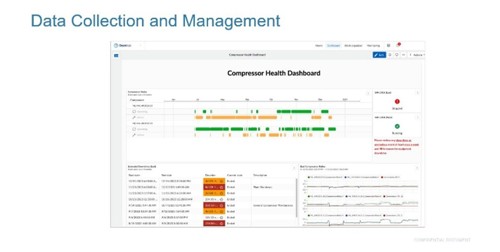
Here (FIG. 5), you can see an example of one of the TrendMiner screens.
HP: What advantages are there for monitoring recips in the enterprise-wide data management system together with a service provider instead of doing it all in the monitoring system itself?
JF: There are several advantages, but I will mention only a couple. Firstly, we have easy access to a lot of processes and other monitoring data for doing more reliable diagnostics. Likewise, proprietary plots and measurements that can only be seen in our system are easily accessed in the PI system by clicking on an icon in the PI Vision screen, as I mentioned before.
Secondly, our monitoring system provides most of the needed performance functionality for diagnostics, but some of these calculated measurements can be fine-tuned in the PI analytics. As an example, the standard theoretical discharge measurement and volumetric efficiency are often customized by end-users and service providers by including their own correction factors in them, making them more accurate. By implementing a multitude of these correction factors into the monitoring system software itself would require enormous software development time, since these differ from one customer to the next. Instead of programming these into the proprietary monitoring software, these performance equations can be fine-tuned onsite in the PI system by each customer or with service support.
This functionality has not been implemented yet for our case study at the time of this interview, but this plus other functionality, including AI/ML (artificial intelligence/machine-learning) algorithms can be easily provided as a PI connected service.
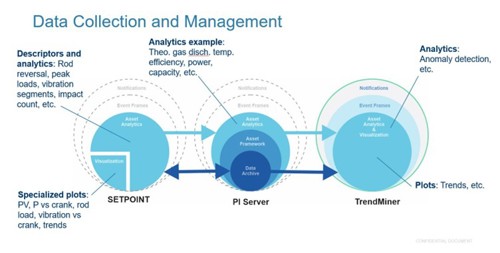
FIG. 6 is a summary of how data is managed for the entire system.
Takeaway. This interview with Jon and Mike provides an example of monitoring a specialized machine that has unique monitoring techniques and diagnostics, and how this information is processed and shared in an enterprise-wide data management system. This initiative is relevant to many companies that are now implementing a data historian and are facing the challenge of integrating it with an optimal machine condition monitoring solution.


Comments