
Digital Exclusive: Simulating the amine treatment of hydrocarbon liquids
Authors: P. CHANDRAN and R. H. WEILAND, Optimized Gas Treating Inc., Buda, Texas (U.S.)
Liquid extraction in the refining and natural gas industries is used for aromatics removal from reformates and pyrolysis gasolines in refineries and from engine lubricating oils in lube oil plants, as well as the removal of sulfur compounds, mainly hydrogen sulfide (H2S), carbonyl sulfide (COS) and mercaptans from liquefied petroleum gas (LPG) and natural gas liquids (NGLs).
Regardless of the application, however, there has never been a truly satisfactory way of confidently designing such units. The best possible approach has been an ideal-stage calculation, augmented with anecdotal, experience-based estimates for tray efficiencies and height equivalent to a theoretical plate (HETP) values. The situation is more difficult because such an approach does not consider how the treater’s actual internals, the dispersed vs. continuous phase, the flowrates it handles, nor the composition and temperatures of the streams feeding it affect its performance.
Apart from stationary trays vs. packing, there is a whole raft of tray-type internals including rotating disc contactors (RDCs), Scheibel, agitated rotating disc (ARD), Rushton, Graesser “raining buckets” (RTL), Kuhni, Wirz and centrifugal types. Vertically reciprocating devices include Karr and pulsed columns. This, and the fact that sieve hole size and tray spacing make a significant difference even to stationary tray efficiency, makes assignment of efficiency an almost impossible task. Packing type, size and material (steel vs. ceramic) can also be expected to potentially (and significantly) improve treater performance.
Sieve tray efficiencies for H2S removal typically range from 5%–25% and HETPs are 5 ft–15 ft. With performance parameters in these ranges, it is easy to understand the difficulty in producing performance estimates that are even remotely reliable. It also clearly indicates the inappropriateness of ideal stage calculations in the first place. Nevertheless, ideal stages and unreliable rules-of-thumb are all engineers have ever been able to call upon—until now.
This article details the game-changing development of a mass transfer rate-based simulator for amine treatment of LPG and NGLs. The complete lack of commercial models was the motivation to leverage the authors’ company’s rate-based gas treatment model as the basis for developing a liquid treater model. The company’s gas treatment simulator has been shown to predict actual performance data with greater accuracy than any other simulator while showing much faster convergence times. The starting point is employing rigorous, accurate electrolyte thermodynamics for amine treating; a well-established, accurate and time-tested rate model for gas treating, carbon capture and sulfur recovery; and a flexible flow-sheeting environment within its existing software.
For the treatment of hydrocarbon liquids, agitation and complicated internals are unnecessary. Interfacial tensions between the aqueous and organic phases are low enough that droplets readily form without further agitation via moving internals with their accompanying tendency to form hard-to-break emulsions. Therefore, present modeling efforts have been limited to stationary equipment.
The system of equations consists of material balances, liquid-liquid equilibria, molar flux equations, and equations for interfacial and bulk-phase energy balances. The solution to the equation set includes tray-wise or packed segment-wise phase flows, compositions, temperatures of the two phases, interface composition and temperature, and component fluxes, as well as ionic composition of the aqueous phase, and amine and water solubility in the LPG. Column internals that are now implemented include stationary sieve trays (effect of hole size, percent open area, tray spacing, downcomer clearance), spray columns (mass transfer zone depth, distributor hole size, total hole area), and a wide range of commercially available packings as well as user-defined packings. In addition to the rate model’s obvious benefit for liquid treaters (i.e., being able to predict performance with unprecedented confidence), the rate model also offers unprecedented diagnostic benefits.
The simulation’s calculations include the Sauter mean diameter of the dispersed-phase droplets (which helps set the interfacial area and hydraulics within and outside the droplets), as well as tray-by-tray and packed segment-by-segment interfacial compositions and fluxes. These results provide insight into the operating regime—specifically, whether the separation is limited by phase equilibrium or by mass transfer, and which phase is limiting. Interfacial area and interfacial tension are also calculated. Simulations are predictive and not reliant on empiricism.
HOW TRAY GEOMETRY AND PACKING SIZE AFFECT LPG TREATER PERFORMANCE
Until now, the effect of tray details—such as sieve hole size and tray spacing, and packing details such as type, material and size—on treater performance has remained largely unknown. All such information has been subsumed into anecdotal, crude guesses about tray efficiencies and HETP values. Indeed, even the effect of amine type and strength on the removal of sulfur compounds from LPG has remained unexplored. Rate-based simulation allows the effect of all relevant parameters to be quantified. The discussion begins with a hypothetical case exploring the effect of column internals on liquid treatment, followed by comparisons of simulations to field data from more than a dozen operating LPG treaters. To conserve space, the effect of operating parameters is not addressed.
The effect of tray parameters. The hypothetical case considers dissolved acid gas removal from a 10% propane, 20% n-butane, 64% n-pentane stream with 1% carbon dioxide (CO2) and 5% H2S. The solvent is 20 wt% monoethanolamine (MEA). Hydrocarbon and solvent flowrates are 22.7 m3/hr and 5.67 m3/hr, respectively. Tray efficiencies for H2S and CO2 were calculated by determining the number of actual trays needed to produce the same level of treatment as a single ideal stage. FIGS. 1 and 2 summarize the results.
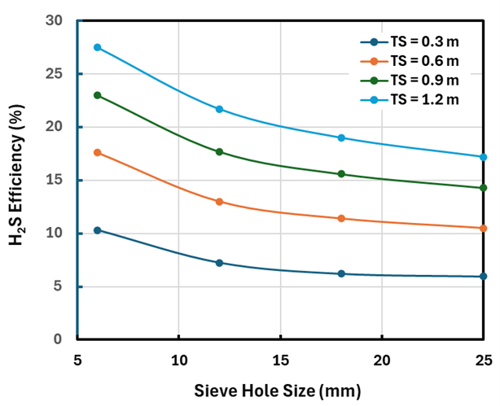
FIG. 1. The effect of tray parameters on H2S single-tray efficiency.
FIG. 1 shows tray efficiencies for H2S removal ranging from ~6% to 27% depending on the diameter of the sieve tray perforations and more strongly on the tray spacing. Note: When the hydrocarbon is more LPG-like (64% propane, 20% n-butane, 10% n-pentane), the residual H2S after one ideal stage of treatment is lower, probably because the hydrocarbon is less viscous than for the pentane-dominated hydrocarbon; however, the tray efficiencies remain nearly the same.
As might be expected, smaller sieve holes are quite beneficial to treater performance because they create smaller, more numerous droplets, presenting greater interfacial area and, therefore, better mass transfer. As can be seen in FIG. 2, this is the case for both H2S and CO2 removal, but it must be balanced against the greater plugging risk from small holes.
Tray spacing has a much greater effect than the sieve hole diameter, but the effect is perhaps a little deceptive. Doubling the tray spacing can be thought of as doubling the volume of biphase over a given tray. Thus, the interfacial area approximately doubles, and it could be expected that the efficiency to roughly double as well. This conjecture is roughly borne out by the curves in FIGS. 1 and 2; however, these figures (and the model) consider the layer of organic phase immediately under each tray—the conjecture does not.
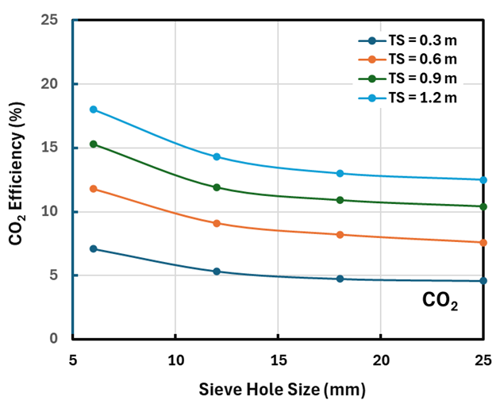
FIG. 2. The effect of tray parameters on CO2 efficiency.
Several other factors might affect static sieve-tray performance. These include dispersing the wrong phase, organic and aqueous flowrates and compositions (which affect phase viscosities and component diffusion coefficients), the reaction kinetics and phase equilibria associated with various amines, and phase temperatures. These will be addressed in subsequent articles.
Effect of packing size. From the eight packed-treater data sets available, seven are packed with ceramic Raschig rings: all but one have a diameter of 2 in. It is instructive to examine the effect of packing size and material. TABLE 1 shows how little difference packing size makes to the HETP corresponding to the separation achieved by a single ideal stage when the organic phase is predominantly propane (LPG) compared with pentane. This is probably due to the higher viscosity pentane (0.18 cP) interacting more vigorously with the packing than propane (0.09 cP) does.
The HETPs for CO2 are considerably higher than for H2S despite MEA being moderately fast-reacting with CO2. Reaction in the solvent phase encourages CO2 transport but leaves H2S removal relatively unaffected because H2S transfer is predominantly controlled by diffusion in the dispersed organic phase. The effect of solvent selection and strength on tray efficiency and HETP will be the subject of a future article.
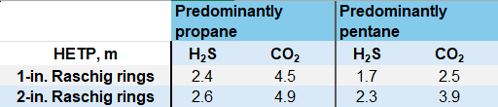
TABLE 1. HETP values (m) for H2S and CO2 with 1-in. and 2-in ceramic Raschig rings
Simulation vs. measured performance. The results of mass transfer rate-based simulations are compared with the measured performance of seven LPG treaters using sieve trays, and eight treaters containing various depths of random packing. The sour liquids contain 0 mol%–2.25 mol% H2S, with one or more of C1–C4 mercaptans and COS ranging from 6 molar ppm–4,500 molar ppm. Solvents included MEA (one case), diethanolamine (DEA) (10 cases), methyldiethanolamine (MDEA) (4 cases) and one case of a DEA-DGA-MDEA mixture. Treater diameters were in the range 0.675 m–2.9 m and contained between 10 and 22 sieve trays (1/4-in. hole diameter on 2-ft spacing) or 20 ft–40 ft of 2-in. ceramic Raschig rings (8 cases), including one case each of 1-in. Raschig rings (33-ft bed) and proprietary packinga (33-ft bed). In three cases, the packing size was unspecified so 2-in. rings were assumed. In all cases involving trays, the number and type were always specified in the original data but hole size and tray spacing were not, so 1/4-in. holes and 2-ft spacing were assumed.
The liquid treaters discussed here were embedded in larger flowsheets, each containing between eight and 12 columns and treaters, so measured data for the lean amine feeding the liquid treaters was not available. Therefore, it was assumed the simulated lean loadings were correct, along with the lean solvent’s mercaptan and COS content. The plants these flowsheets represent were handling significant percentages of H2S in various gas streams, but the liquid treaters usually had only a few 1,000s of ppmv H2S in the sour liquid. When residual H2S in the treated liquids was detected at a measurable level, it was invariably found to be < 1 ppmv. Simulated values were 0.3 ppmv–2 ppmv, which is a very satisfactory agreement—H2S removal was not performance limiting.
The simplest way to compare simulation with plant measurements is on a parity basis. FIGS. 3 and 4 compare measured and simulated mercaptans and COS levels in the treated liquid from trayed and packed columns, respectively. Given the approximations and estimates that had to be made to fill in missing data from sometimes sketchily documented equipment and operating conditions, the extent to which simulations reproduce performance metrics is remarkable. It should be emphasized that the simulated results shown here are, in every sense, pure predictions. They certainly lend credence to the efficacy of the fundamental model used as the basis for the simulator. It seems that most of the treater details germane to tray and packing performance in sour, liquid-hydrocarbon service have been properly quantified.
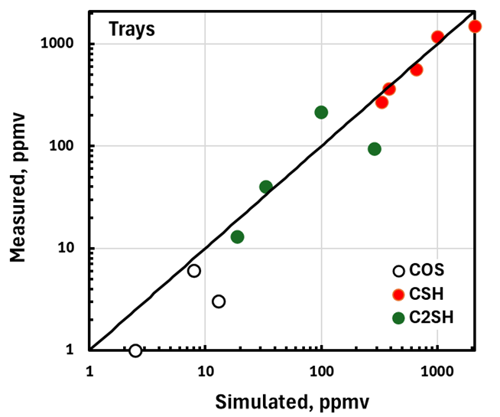
FIG. 3. Validation of trayed liquid-treater simulation.
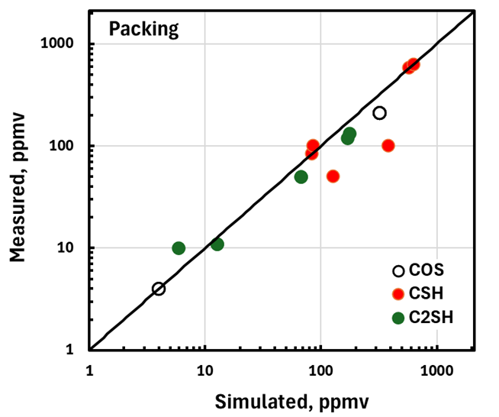
FIG. 4. Validation of packed liquid-treater simulation.
Takeaway. For the first time, engineers can analyze and predict the performance of trayed and packed treaters in acid-gas liquid-hydrocarbon service with the same reliability that rate-based simulation of gas treatment using amines has provided for the past 30 yr. The authors’ company is adding other internals to those already available and is addressing other applications of liquid extraction, including aromatics removal from pyrolysis gasoline fractions in refineries and aromatics removal from lube oils. Rate-based simulation of liquid-liquid systems is truly revolutionary and opens to reliable, predictive simulation a whole new world of unit operations that still rely on antiquated rules of thumb and gross approximations.
NOTE
a Intalox Ultra® packing
ABOUT THE AUTHORS
Prashanth Chandran works as OGT’s Lead Software Developer. He earned a B.Tech degree in chemical engineering from Anna University, India in 2016, and an MS degree in chemical engineering from Oklahoma State University in 2018.

Ralph Weiland formed Optimized Gas Treating in 1992 and serves as its Chairman. Dr. Weiland is a graduate of the University of Toronto with a PhD in chemical engineering. OGT developed the ProTreatÒ mass transfer rate-base gas treating simulator and the sulfur plant simulator SulphurProâ.


Comments